

4 Insightful Data Sources for Cyber in 2021
Not just because of the evolving threat landscape, that during the 2020 pandemic has become even more volatile, it is a strenuous task to gain objective insights into the numerous chains of the cyber market value chain. Even where data is, or could be made available, the responsible firms, like insurers and reinsurers, are often not incentivized to share their information with their competitors, researchers, and the general public. Therefore, the following 4 data sources provide rare insights into the cyber market at the beginning of 2021.
1. SERFF Filling System ()
Especially for a young line of business like cyber, collecting and analyzing actual offerings of the biggest players is a necessity to pick up and stay on top of trends in the market. The System for Electronic Rates & Forms Filing (SERFF) of the National Association of Insurance Commissioners (NAIC) is a great source for cyber insurance rate schedules and forms for 46 US states. Insurers in the US can use the SERFF system to submit documents to their state insurance regulator for regulatory approval, which in turn also allows other interested parties to view and download them.

The SERFF filings have already been used as the basis of analysis for several academic cyber papers, for example, , which analyzes over 200 cyber rate schedules, or , which uses 26 rate schedules as a basis to model a consensus cyber loss distribution. While it is certainly the least pretty of the four sources that we present in this article, as the data requires manual analysis and the search interface needs a little getting used to (see the above mentioned papers for more infos), it offers insights like no other into the historical and current markup of the cyber market by sharing, among others, up to date information on the pricing, coverage logic and security related obligations.
2. Chubb Cyber Index ()
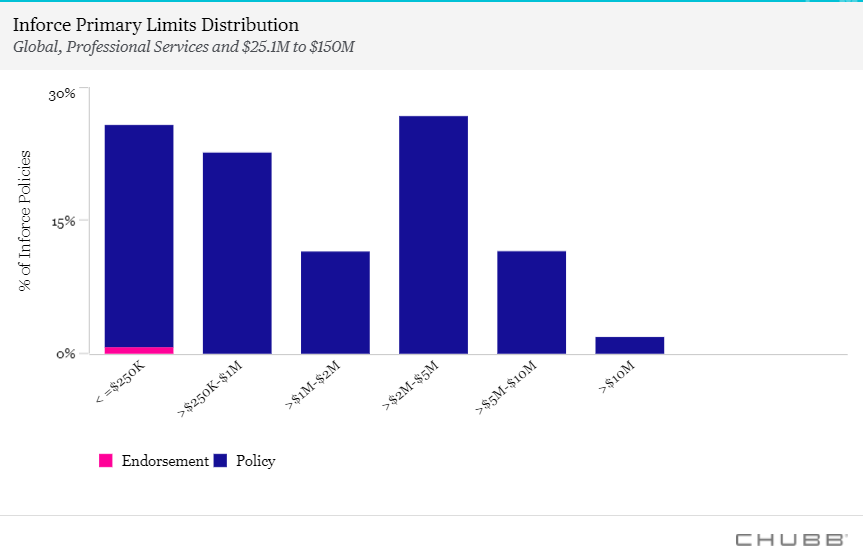
Chubb, as of 2019 the insurance carrier with the largest cyber portfolio in the US with $325 Million in written premiums (see ), provides unparalleled insights into its cyber claims history, coverage details of its over 50,000 cyber policies in force, and markup of its customer base with the Chubb Cyber Index (CCI). The three main tabs of the CCI are:
- Under “Costs Breakdown”, the relative share and average costs per incident after coverage element (first party damages, third party, etc.) in the cyber claims costs incurred by Chubb since 2009 can be filtered after industry, company size, and time interval. The tab allows for interesting comparisons between industries. For example, while for companies in the Retail/Hospitality industry the largest share of claim costs in the last three years was incurred by incident response counsels with 28.6%, the highest expense for public entities was forensics, accounting for 52.8% of the overall costs.
- Under “Incident Activity Growth” the CCI provides insights into the growth, actions, actors, and affected assets of cyber incidents, filterable after industry, revenue, and company size. For 2019, the most potent attack vectors in the portfolio of Chubb were social and malware attacks, accounting for 42% of overall attacks.
- Under “Peer Purchasing Insights” the CCI shows the deductible and coverage limit(s) of the current cyber policies in its portfolio, filterable after industry and revenue size of its clients. Professional service firms, for example, with a revenue of $25 to $150 Million have most often a coverage limit of $2 to $5 Million.
3. Hackmageddon Breach Timelines and Statistics ()
Maintained since 2011 by Paolo Passeri, hackmageddon.com curates and classifies cyber incidents, makes the resulting datasets available to the public, and posts monthly statistics and timelines regarding the current cyber threat landscape.
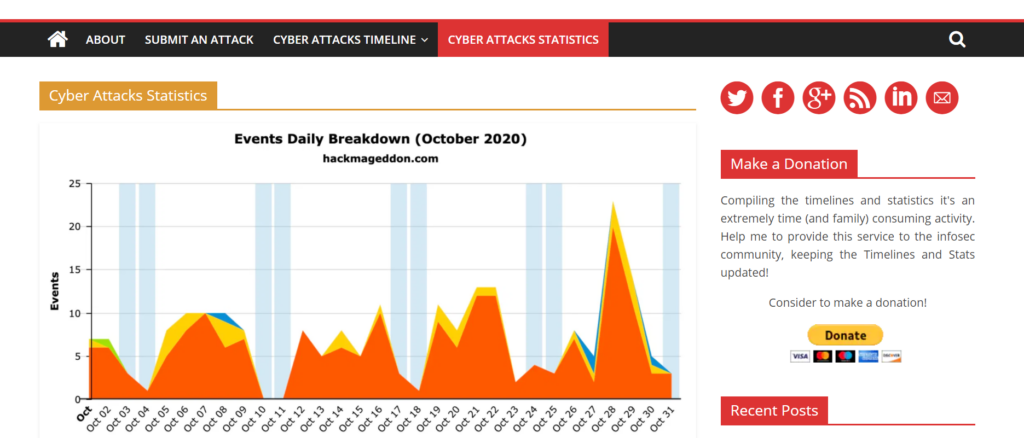
The dataset of hackmageddon is compiled by aggregating content from public sources, such as blogs and news sites. While the underlying raw dataset is only available via request (see the comment section under “About”), it has already served as the basis for academic research, for example, .
4. GDPR Enforcement Tracker ()
The General Data Protection Regulation (GDPR), which came into force in the European Union in May 2018, mandates data handlers to utilize technical and organizational measures to appropriatly implement the data protection principles set forth in it. The GDPR Enforcement Tracker of CMS Hasche Siegle provides data and statistics about fines levied by regulators for violations.

Like Hackmageddon, the tracker is based on public sources, so it is likely not complete. Besides the amount of fines and concrete violations of the GDPR in the fine database, the statistics page gives a good summary of the highest fines given out, a breakdown of fines by industry sector or country, and the monthly number of fines since May 2018.